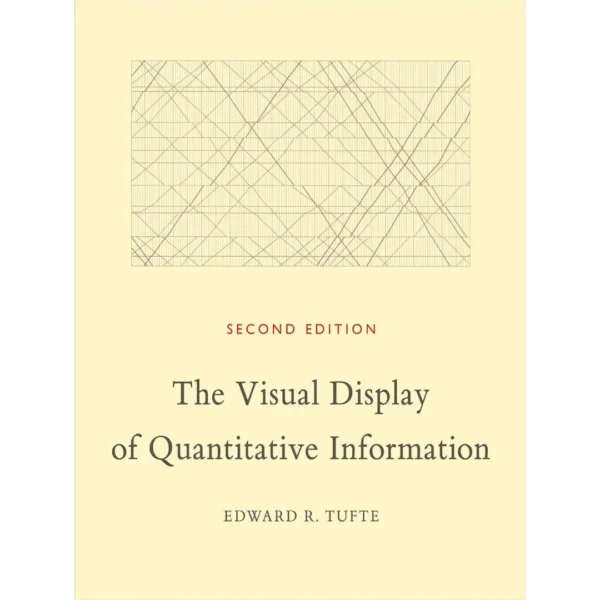
The Visual Display of Quantitative Information, 2nd Ed.
Original price was: $50,00.$17,99Current price is: $17,99.
- 100% Satisfaction Guaranteed!
- Immediate Digital Delivery
- Download Risk-Free
✔ Digital file type(s): 1𝐏𝐃𝐅
The classic book on statistical graphics, charts, tables. Theory and practice in the design of data graphics, 250 illustrations of the best (and a few of the worst) statistical graphics, with detailed analysis of how to display data for precise, effective, quick analysis. Design of the high-resolution displays, small multiples. Editing and improving graphics. The data-ink ratio. Time-series, relational graphics, data maps, multivariate designs. Detection of graphical deception: design variation vs. data variation. Sources of deception. Aesthetics and data graphical displays. This is the second edition of The Visual Display of Quantitative Information. This edition provides excellent color reproductions of the many graphics of William Playfair, adds color to other images, and includes all the changes and corrections accumulated during 17 printings of the first edition.
89 reviews for The Visual Display of Quantitative Information, 2nd Ed.
You must be logged in to post a review.





















Stephen M. Marson –
Years ago, I purchased the first edition of VISUAL DISPLAY OF QUANTITATIVE INFORMATION. The second edition provides high-resolution color reproductions of the several graphics found in the first edition. In addition, corrections were made. However, to most readers/users, I doubt that the changes would be worthy of purchasing the second edition if one already owns the first edition.
Edward R. Tufte is a noteworthy scholar and the presentation of the material presented in this book is awe-inspiring. Tufte has also compiled two other books that can be best described as quite remarkable. These additional books are entitled, ENVISIONING INFORMATION and VISUAL EXPLANATIONS. All three of these volumes are not merely supplemental textbooks; they are works of art.
My intent was to use VISUAL DISPLAY OF QUANTITATIVE INFORMATION as part of teaching my statistics course. Students, but mostly faculty, are overly impressed with inferential statistics. Graphics play an important role in the understanding and interpretation of statistical findings. Tufte makes this point unambiguously clear in his books.
Two features of VISUAL DISPLAY OF QUANTITATIVE INFORMATION are particularly salient in teaching a statistics course. First, the concept of normal distribution is wonderfully illustrated on page 140. Here the reader is reinforced with the notion that in the normal course of human events, cultural/social/behavioral/ psychological phenomena usually fall into the shape of a normal distribution. The constant appearance of this distribution borders on miraculous. Just as importantly, it is the basis for accurate predications in all areas of science. Tufte’s illustration (page 140) speaks to this issue much more clearly than a one-hour lecture on the importance of the normal distribution. Which goes to show — once again — “a picture is worth a thousand words.” Sadly, the illustration on page 140 is small and in black and white. I wish the second edition included a larger reproduction of this photo. A color presentation would have been helpful.
Second, Tufte continues his unrelenting pattern to reinforce the importance and impact of illustrations in understanding complex concepts. In particular, page 176 demonstrates the impact of Napoleon’s march to Moscow. The illustration is both profound and eerie. The reader is left with a feeling of death and pain for the foot soldiers…
Frederic Horst –
I was genuinely impressed by both the quality and richness of this and Edward Tufte’s two subsequent books (Envisioning Information and Visual Explanations). Together, these three beautifully presented volumes are by far the best discussion of graphical design principles that I have come across to date. Tufte presents potent examples that graphical integrity and clarity need not result in oversimplistic charts, graphs and displays. This is not a “how-to” book, but an intelligent and thought provoking analysis of opportunities in displaying and explaining data and events.
Ted Brandewie –
Quite insightful, especially the historic perspective. The only difference between the newer and 1983 edition is color is added to a few of the charts.
Lars Bergstrom –
Tufte isn’t considered the master of this field for nothing; this work debunks a lot of common practices in data display, including use of color, composition of images, and the importance of scales and labels. An excellent grounding is provided in theory about how to effectively present quantitative data, but the practical advice and examples are also comprehensive.
The only thing this book was missing for me was how to tie in data display with the rest of a writing — how to best visually display your data near descriptive text, but get the flow right so that readers will get the most value from it. Of course, you can get some of that information by osmosis merely by reading his beautifully-composed book.
Greg N –
Very good book, explained everything in black and white, really cant go wrong!
Two Wheel Touring –
If you have ever wondered how statisticians communicated data before Excel then you’ve found the right book to settle your curiosity. For some this may be a seaside read, but for me it is a great coffee table companion. I’ve learned something new every day for the last couple of months. This won’t make an artist out of anyone, but it will guide you through the thought process of choosing appropriate methods to convey data.
Andrew Oliner –
Tufte’s work is absolutely essential for everyone in the business of creating or consuming Information, which is to say, Everyone. Although his book is extremely beautiful, some of the most essential advice is so crystal-clear that even the Graphically Challenged will gain from reading it.
Although readers will also get a lot out of Tufte’s other two books, “Envisioning Information” and “Visual Explanations”, there is no question that this is the book that had the largest impact, and which contains the most original thinking. This book was like a bucket of cold water in the face of established thinking regarding Graphic Design and the reporting of Information.
M. Miller –
Very good book. I really enjoyed the quality of graphs and interpretion of them. Tufte gives practical guidelines and observations about graphs and graph-making.
Vincent Poirier –
The Visual Diplay of Quantitative Information is not exactly a how-to book, in that it won’t give you step by step instructions on how to create charts. Rather Tufte shows us principles of good design, principles of bad design (i.e. how people lie with graphics) all accompanied by many inspirational examples.
His examples strike us with their beauty and economy and show us how picturing data makes a huge difference in how effectively and quickly we understand it. Looking at Mivart’s chart of Napoleon’s march on Moscow, or the Salyut 6 hand drawn mission schedule, or a Japanese train schedule can only make a geek like me gush out “Way cool!”.
I find it gratifying that Tufte takes so many examples from Japan, where I live. The Japanese are often accused of simply working with other people’s ideas. This is naive and the Visual Diplay of Quantitative Information provides an excellent counterexample of the Japanese being sophisticated leaders in a creative endeavor.
Vincent Poirier, Tokyo
Slider –
An interesting and well presented book, but very specialized.
OALSML –
This book was very nicely laid out, and the ideas for presenting were good. Sometimes it was a little hard to follow because it rambled a little. But I did get some good pointers that I can use to visualize my data.
Iacobus de arenoso –
Andrew E. Stratton –
This book has been talked up by about every design professional I’ve seen speak at conferences across the country. I bought it to hop on the band wagon — and it was a great purchase.
It starts as a bit of a dry read, but has some of the greatest content and insight into the theory and profession of information design. Check it out.
Neal G. –
Tufte points out common general flaws in presentation of data. He then goes on to examine specific conventional ways of displaying information (boxplots, scatter plots, etc.) and proposes improvements to them.
This is an approachable and informative book which will, as the title says, get you thinking about effective and clear ways to display data.
Eric Methot –
In this book Edward R. Tufte show us how we tend to over complicate things and how visual effects tend to distort the story that the numbers have to tell us. He introduces the concept of information to ink ratio is introduced, which is a fancy way of saying that each pixel on a chart should add information or help to it’s comprehention.
The book is also a beautiful collection of historical charts, whose authors intuitively knew the importance of un-cluttered information but to which Edward Tufte adds his personal touch to make them modern works of art. My personal favorites are the “Carte figurative”, which shows the progress of the Napoleonic war and the one shown on the book cover, which represents a train schedule.
Aneil and Karen Mishra –
I own all of Edward Tufte’s books, and regularly order his booklets for my MBA students. The reason is simple: to make good decisions, and to help others make good decisions, one must convey data as information and not simply as numbers, words, or even pictures. Business periodicals regularly violate the admonitions we learned in our introductory statistics courses, including failing to use zero as the bottom of any scale (these periodicals don’t use zero in order to exaggerate changes). The reason that intelligent people convey data inappropriately is either to deliberately distort it, or because they’ve failed to read Tufte’s books.
Once you’ve purchased this first book by Tufte, you will never look at charts or other graphical displays without a jaundiced eye. You will also will begin to be more honest in how you convey information to others. You will make better decisions, and you will raise the standard for other communicators and decision makers. Life and death decisions do get made on the basis of data, and not just in the sciences and medicine. Buy this book and you will have a very tough time putting it down.
Aneil Mishra
[…]
Tobeornotobe –
I was able to read this fairly quickly. (stealing a few hours here and there at work).
Although I did not find any direct solutions to my current problems – it definitely opened my imagination to consider new possibilities.
J. Felix –
Tufte’s book is a very fine book on data graphics.
Although this book gives a lot of simple advice on how to effectively communicate quantitative information, it is not just a recipe-like book, as it also makes you think about a data graphic as something that is telling a story with numbers.
Beware that not all advice given is easily applied using common office suites. This is by no means a problem with the book, it is just that the text is not at all software-oriented. In fact, you may start to see the limitations in the office suites themselves. So, for those who just want some fast rules to use in their favorite software, this book may not be enough, or even the most recommended one. For all other readers, I highly recommend it.
Thomas Reneau –
This book is great. It has a lot of useful insights. However I was expecting something more practical… Maybe it’s not a guide but a book with some nice historical data and references. Superb graphs and pictures.
Yes I would recommend you to buy it .
Trevor Burnham –
The title might lead you to think that this is a dry book, of interest only to stuffy academics in statistics-heavy fields. It isn’t. Yes, people in those fields should read the book, and the world would be a better place if they’d do so before foisting their graphs on the rest of us. But this book should be enjoyed by everyone with an interest in graphic design, including artists and web designers.
I would recommend reading Tufte’s entire “tetralogy” in order, starting with this one, followed by Envisioning Information, Visual Explanations and Beautiful Evidence. I’d say that this one is the second-best, after Visual Explanations.
Wyze Sky –
Anyone who deals with organizing and communicating data needs to read and periodically review this classic work.
It will not give you the answer, but will stimulate you to think of different ways to present information with more depth and clarity. The concepts and examples will change your perspective and will absolutely improve the quality of your work. If you get just get a single chart improvement idea from the concepts presented, it is well worth the cost and time. Keep it on a bookshelf close by.
wil3 –
This book is authoritative and clear, providing plenty of clear examples and evidence to support the author’s claims. the book is structured linearly, presenting examples of good graphic design followed by examples of bad graphic design, and then delving into the specific characteristics that differentiate the two. In the last few chapters, the author develops a clear and consistent paradigm for making graphs and tables that are both effective and attractive.
Tufte’s writing style is clear and engaging, making this book very readable and infromative. I’ve found that reading this book has changed the way I approach even simple tasks such as designing my resume, and I feel that this book would be even more valuable to anyone in a design oriented profession.
A highly recommended book for anyone interested in finding more concise ways to express their ideas visually.
FM –
The book was great. It was nice to come across a book that wasn’t interested in making itself loud and noticeable based on cheap graphic tricks. The book was great because the information on it was based on Information Graphics with a strong emphasis on “Information.” I’m a Digital Illustrator/Designer/Animator/Editor, with a background in Statistical Analysis in the Social Sciences, and found it amply useful when designing for Information Graphics. I love the book. Would recommend the book for anyone who wants to consider efficiency in information delivery when designing.
Jean-Pierre Riffaud –
Widely acclaimed work by Edward Tufte. Highly recommended to engineers, scientists, economists, historians and general public. I particularly loved the “Pertes successives en hommes durant la campagne de Russie” by the retired Inspector Minard
Colin A Haley –
This is a must have for anyone dealing with numbers reporting. Use the principals when designing new software products. Great book
Douglas G. Thomas –
Edward Tufte is to presentation of data in a graphic form as is/was W. Edwards Deming to quality management. I’m glad there are more books out by Edward Tufte, but this one will always be a first love!
Guillaume Midtlyng –
I first heard about this from an Eli. He took a course at least from Tufte. It is data représentation as an art. In spite of the passage of time; history and art do not âge.
Nathan J. Grant –
Excellent book for anyone working with data. Visualizing data is not just an art, it is a science. Read this book!
Mack&Cheryl –
This book I remember along with agreat many other books and ideas I have retained from that wonderful resource. Since I am getting into visual noting, data analysis, and presentations, now is the perfect time for this outstanding book to re-enter my life.
ToonArmy –
A classic book.
Excellent arguments for and against graphical representations (and twisting perception) of data. Examples are now dated but still valid.
Math Customer –
First off all its the prettiest book I’ve ever bought for research purposes. Its a to the point description of what is good and what is bad in data visualisation. As Race strategist for a solar car race team I’ve found methods of displaying large amounts of data and making accurate decisions on the visual message they carry within the pages of this book. The entire collection is on my wishlist now.
M. Wyant –
Tufte is the king of visual data presentation–even if you are just plotting quarterly revenues in Excel, this book will open your mind to good and effective display of your data. The concept of a data:ink ratio is one that has stuck with me for years.
CB –
For graphic designers and artists – this is a pretty cool book. Being able to create effective graphs and graphics is essential for communicating with the viewer. Glad I purchased it.
Sergey Epifanov –
beautiful book by a great author. If you are interested in the questions of readable representation of data, this book is for you.
Andrew –
A really nice read. I have a Ph.D. in Engineering, and communicating concepts clearly is vital for me day to day. This book has some great insights on communicating clearly.
Francis –
Educational and entertaining If you create charts or work in a company that creates charts get this book and break away for the powerpoint numbness
Michael Donnenberg –
This is the gift I give to all trainees who leave my lab. I’ve purchased dozens of copies. My students and post-docs call it “the book,” as in “I am so ready for the book!” Once they have it, they universally appreciate it. If I could give it six stars I would. Tufte is a hero.
742 –
the ‘1984’ of charts? okay not really, but its some illuminating s***; its an amazing text that can turn what you might have thought of as one of the dullest most banal subjects in the history of creation into something interesting and exciting. it not only conveys information, but can stoke the fires of passion for a subject. which is good. it didnt fix my poor grammar, which is bad. it wasnt supposed to fix my poor grammar, which sort of negates the previous point. im going to stop now, for the fear that i have made myself appear a fool.
Nathan –
This book is beloved by everyone I know who must communicate complex information to non-technical audiences. Definitely worth keeping at hand.
Daniel J. Herkes Jr. –
As a prologomena to the visual arts, this book cannot be underestimated. Anyone, especially in the age of instant information, who posts graphics to support an argument, should probably have a look at this book. The advent of social media should be a mustering point for all those who attempt to explain life and especially measurments to their friends and family.
Melanie Whalen –
I give this a 5 star because the person i bought it for almost cried out of joy when he opened it. I thumbed through it, and almost immediately fell asleep. Great for your “brainy-yet reclusive” or “insomniac” family members
TropicThunder –
this book was recommended to me by The Happiness Project. what a find! excellent reading, even if you are not into mathematics, but the pictures are wonderful.
Charles LaHeist –
If any aspect of your job is faithfully representing statistical data, this author produced the seminal works. This book is my favorite as it was most pertinent to the work that I do, and I believe it to be the most popular. If you do any scientific or mathematics-based work, this book should be on your shelf.
Helen –
It is an excellent book. The graphics are good and the condition is great. Would defiantly purchase it again in the future if the need arises.
Donna Lavdis –
Who would have ever thought that charts could be so interesting. He is right when he says that most of what we see today is “chart junk”
Will –
It’s beautiful and fascinating, but it’s value lies in it’s collection of innovative images, not in it’s exposition, which is thin, and mostly descriptive rather than analytical.
HipShooter –
This is a classic. If you are interested in graphing, you’ll love the book. If you’re not, you should be.
Stephen C Chesney –
Absolutely should be required reading for anyone in science, technology, policy, journalism or any profession demanding clear, concise and informative visual communication. This book changed my life, no joke.
Mark Becker –
Lots of great info in this book. Great first read and to keep coming back for refreshera.
Nima Gardideh –
I read this book as a preparation before designing dashboarding tools and systems for an analytics product.
It was astonishing how much thought Edward Tufte has put into his data graphic design theories and how the principles in this book still hold strongly to this day.
Absolutely recommend this book to anyone who wants to be better at visualizing data in a useful way to their users/customers/management.
SRS –
What can I say–Tufte is the best. I use it with MS and PhD students as a way to help show different approaches to visual displays of their research results.
Todd –
Gaj Aiyer –
Bought based on my boss’s recommendation to expand my knowledgebase in creating compelling visuals. Realized Edward Tufte is the Guru I have been looking for! Bought it along with other 2 books to complete the set.
Math Customer –
The man is brilliant and the book is full of great information and ideas. Should be on every Analysts desk.
Chris Hill –
Beautiful book with an excellent historical perspective on graph theory. Highly recommended.
aMac –
A great primer on how to visualize data in a way that is super approachable. I have already started applying the heuristics I have learned from Tufte to my own projects
Michael Carlton –
I bought my copy years ago during PhD days and still pick it up periodically.
Krish Krithivasan –
Brilliant book, if you really want to learn anything about Data.
Jonathan Escamilla –
Very needed book for scientists, engineers and anyone presenting data.
Great examples and easy to read or skip around.
John –
Edward Tufte literally wrote the book on data visualization setting off a growing trend in beautiful and informative infographics. Highly recommend.
Skeptic –
Tufte has written several outstanding books. I bought this copy for our investment advisors because they, like so many people, were misusing graphs. If you use visuals to explain data and their implications, read the book and keep it at hand. It’s the equivalent for data of Fowler’s Modern English Usage.
Timothy –
I got this for my Trading Profession and understanding visual Charts is CRUCIAL!
Sergio Uribe –
Dimitry Rotstein –
This book is as amazing as it is beautifully illustrated and packed with useful tips. After reading it I’ve never looked the same way at charts. It’s amazing how bad most of the existing charts are. It’s like taking a course in professional photography and then realizing the difference between a professional photograph and an amateur snapshot.
Sofia Georghiou –
Great graphs, great quality, great content. Was expecting more colored graphs but overall very happy with purchase.
Ulises Arnold –
The book is worth buying even if you just read the passages dedicated to William Playfair.
JOSE FERREIRA PINTO –
Best of best. Master Edward lead us through a journey of visualization across centuries. It is the utmost important book to start studying data visualization and the nuts and bolts of its application to meaningful business cases.
D Marshink –
This book is excellent, considering the subject matter. If you don’t like the subject matter, you won’t like the book. Dr. Tufte is the da Vinci of our time.However, the reason I’m giving this five stars is because I bought it used and it came with an autograph by the author. Pretty cool. Not something the seller could control, or even knew about, but it’s one of those really nice “extra” things that happen in life.
Flavio Amaral –
Has very good insights about how to turn data into images and how to deliver them clearly.
Terri Hoare –
A classic masterpiece in the art and science of data visualisation.
pdid –
a classic; the fundamental presentation on which the series was built.
Robert Jamison –
When my grumpy old-man co-worker recommended I read Tufte, I expected some outdated textbooks. This is more of a long form exposé on how to have your analytics taken seriously. 10/10, would buy again (I already bought his other two books)
Alon Goldring –
Great book about graphical display of data
B. Johnson –
Excellent product and service!!! *****Thank you!
Jeremy –
This one should be a permanent part of your reference library. Looking at a visualization and then not only understanding the presented information, but also learning a concept or process from it is brilliant. The hard work is trying to determine the message you want to convey. If I had no intention of using imagery to project meaning or to facilitate understanding, I would be fascinated by this book anyway.
Matthew Schnars –
Detailed history of visualization. Foundational read for anyone working in the field.
Greta Maghaqyan –
Great book. I keep on re-reading it.
Thomas B. –
A classic book in the data visualization field.
ChrisBH –
I bought this book as it was recommended reading by an excel MVP (I’m on a bit of an excel learning binge) in addition to a few others by Stephen Few. Though the cover of this book was the most “bland” of them all I ended up reading the intro and the first chapter and becoming very interested in the ideas on the visual presentation of (quantitative) data, particularly the graphic showing the number of troops that Napoleon started and ended with on his campaign into Russia (I wasn’t even sure of what multi-variate data was but I soon gained an appreciation for its proper presentation).
As each chapter went on I became even more interested in the material that was presented as it seemed very logical and intuitive. I especially enjoyed Professor Tufte’s guidelines on maximizing the “data-ink” and minimizing “non data-ink”, and was amazed at how he applied these guidelines to graphs I have been using and teaching for many years, making them seem simpler and not as cluttered even if he suggested the “unthinkable” by leaving out gridlines or piece of the axes.
I must admit that I am a bit skeptical about leaving out grid-lines when I produce graphs in excel but I appreciate that making them lighter really helps to de-clutter a graph. But I was totally blown away by how he simplified box and whisker diagrams into quartile plots and how he even removed portions of the vertical and horizontal axis making the graphs easier to read and somewhat more informative.
I’d love to teach these principle to my students (I’m a private tutor) but I know that their in-school teachers would not allow their use as the syllabuses are somewhat antiquated (as are some of the teachers, their beliefs, and methods). They’d probably lose their minds about what Professor Tufte says about pie charts :-D, which, by the way is not to use them as there are better ways to present data. “The only thing worse than one pie chart is more pie charts”.
All in all, as someone who’s not from a design or art background and with a bit of a background in maths I thoroughly enjoyed this book, its principles, insights, and suggestions, and though it may not be everyone’s cup of tea I would readily suggest it to anyone who has more than a passing interest in graphics especially if they’re presenting quantitative data. The principles are logical and intuitive, and I really do think that the presentation of graphics should (like anything) be taught well (eschew the decorations/ducks!)
This book is invaluable and has awakened my thirst for more knowledge.
I’m looking forward to reading more!
Milea Kirst –
As someone who makes a lot of graphs for work, this book helped me be more mindful about that process. The author is a bit extreme in is minimalism, so I would take his suggestions with a grain of salt, but even so it was an interesting read. Mine came with an insert about PowerPoint presentations which was pretty funny. This book is a bit theoretical though; for a practical how-to guide I’d recommend Knaflic’s Storytelling with Data.
JBGrun –
Just what I wanted.
Hale –
very interesting book. a quick read but a good one for all producers and consumers of visual data.
Etienne Lareau –
Awesome!!
Bea Bibamor –
I love this book, very interesting history of graphs, and ways to improve when showing data in plots.
Dr. Jason Grayson –
An essential book for anybody dealing with data in any capacity. Should be on all scientists’ bookshelves.
Arthur J. Jacobson –
Edward Tufte, a professor of Statistics at Yale, is a visual genius. If you’d like to see confirmation of that, google “Edward Tufte sculpture” and you’ll see what I mean. This is an essential book for people in many, many lines of work, and for those who’d like to cultivate an ability to see through the visual displays that others use to mislead, obscure, and get away with nonsense.
QM –
I do a lot of work conveying information to leaders and technical people and wanted to move away from PowerPoint, using data in a “native” format.
This book is about efficient design and layout. It does a great job conveying principles for clear and precise communication. It’s a bit dated, coming from an era when all charts and graphs were made by hand, but principles don’t shift. A reference I will use again and again.
B. Edwards –
A very careful edition about most great graphics in the story of statisticts
Evan Canady –
This is a great resource for modern data analysts. Even though the book was written over 30 years ago the principles still apply.